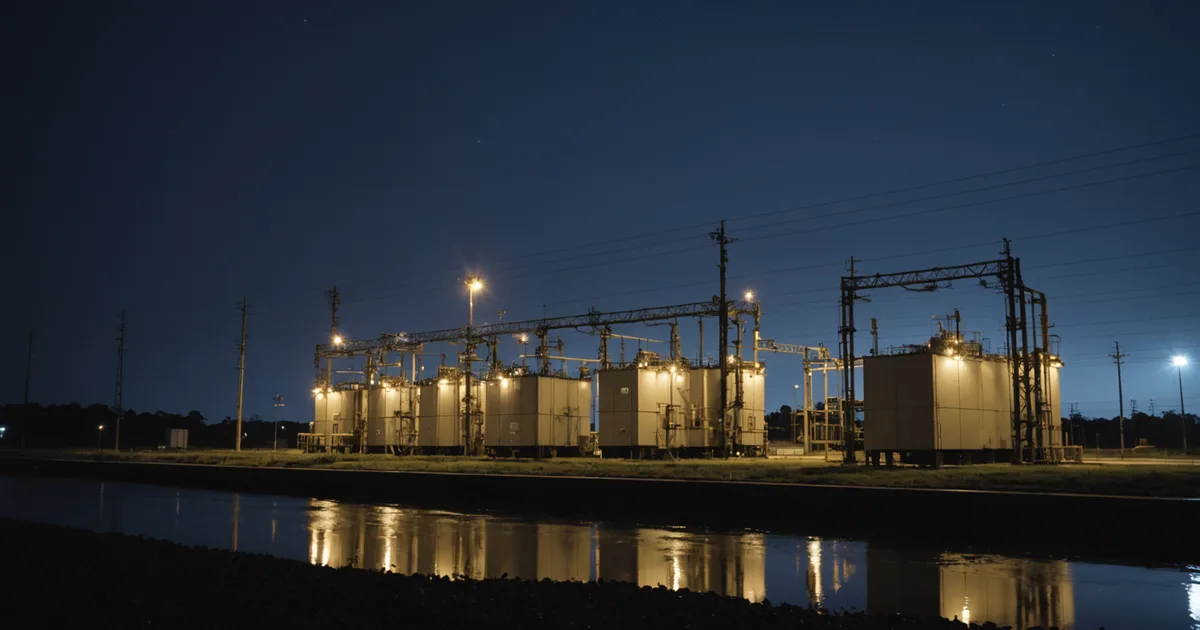
Colorado's semi-arid climate, significant elevation variation, and strong afternoon convective storm season create grid load patterns that standard forecasting models built on national average climate data systematically underweight. Ampgrove was built in Denver because this is the market where we started learning these patterns, and our models reflect that regional specificity.
The convective storm challenge
Colorado's summer afternoon thunderstorm pattern is one of the most predictable yet challenging load drivers in the state's distribution grid. A storm system that moves through the Front Range in mid-afternoon can drop temperatures by 12 to 18 degrees in 30 minutes, cut direct solar irradiance from peak to near zero, and reduce HVAC load sharply while simultaneously increasing lighting loads as daylight dims. The net effect on feeder load depends on the local mix of solar generation and HVAC load, and it happens faster than a weather-naive model expects.
Standard load forecasting models trained on hourly temperature data handle gradual temperature transitions reasonably well. They do not handle rapid temperature drops with simultaneous irradiance changes as well. Ampgrove's Colorado models are trained on 15-minute resolution NWP data with explicit storm proximity features derived from radar composites. The goal is to encode the speed of Colorado weather transitions, not just the temperature endpoints.
Elevation and load heterogeneity
Colorado utilities often serve load areas that span significant elevation ranges. A single utility might have service territory from 5,000 feet to above 8,000 feet elevation. The temperature differential between service areas at different elevations can be 10 to 20 degrees at any given time. A single utility-wide temperature forecast does not capture the feeder-level load response correctly. Feeders serving higher-elevation residential areas will have different cooling degree day accumulations and different peak timing than feeders in metro Denver.
Ampgrove assigns each feeder a local NWP temperature series based on the geographic centroid of the feeder's service area rather than using a single statewide or utility-wide temperature proxy. This adds complexity to the data pipeline but produces meaningfully better accuracy on elevation-heterogeneous service territories.
Solar penetration and the midday duck curve
Colorado is one of the highest solar-penetration states in the country per capita. That penetration is showing up in feeder-level load data as a midday load reduction that is growing year over year and that has a high variance driven by cloud cover. Feeders in high-solar-penetration neighborhoods in Boulder County or the outer suburbs of Denver are seeing midday load shapes that change the peak timing profile compared to what the same feeders showed five years ago.
A forecasting model trained on data from before the current solar penetration levels will underestimate midday load reduction and produce peak timing forecasts that are systematically early. We address this by retraining feeder models quarterly, which means the model always has training data from periods with similar solar penetration levels to what it will be forecasting into.
Building regional specificity into the forecasting pipeline
The broader principle is that load forecasting accuracy depends on encoding regional climate characteristics into the model architecture, not just into the training data. A model that treats temperature as the only weather variable, uses a single regional temperature series, and does not account for the speed of weather transitions will underperform in a market like Colorado compared to a model specifically designed for the climate reality operators face.
Wind and evaporative cooling patterns on the Front Range
Colorado's chinook wind events, which bring warm dry air rapidly down the eastern slopes of the Rockies, create sharp temperature spikes in winter and spring that can move heating loads from near-peak to near-zero in a matter of hours. A single day in February can start at minus 10 degrees Fahrenheit, warm to plus 55 by afternoon, and drop back to 10 degrees overnight. The feeder load profile for a residential service area on that day looks nothing like a standard winter day model would predict.
Evaporative cooling is common in Colorado's dry climate and behaves differently from refrigerative HVAC in ways that affect load forecasting. Evaporative coolers draw significantly less power than compressor-based air conditioning. A service territory with high evaporative cooler penetration will show a different relationship between temperature and cooling load than national models assume. Ampgrove's Colorado models are calibrated to account for the mix of cooling technology types in each service area.
Seasonal load timing differences from national averages
Colorado's semi-arid climate means spring and fall shoulder seasons look different than they do in more humid markets. The spring peak period is compressed relative to the Midwest or Southeast: temperatures can go from heating-season cold to cooling-season warm in weeks rather than months, and the dual-fuel inflection point (when customers shift from heating to cooling) happens faster. This affects how load forecasting models need to handle spring shoulder months.
Fall is similar but with the added complexity that Colorado's intense fall foliage tourism season brings significant load variation in mountain resort service territories, a pattern that does not appear in standard national utility load data. While most distribution utilities serving Colorado's Front Range urban corridor do not have direct resort territory exposure, several serve service areas where seasonal second-home heating loads create October-November patterns that differ from the historical baseline.
What this means for utilities evaluating forecasting solutions
The practical implication for Colorado utilities evaluating AI load forecasting solutions is to ask vendors specifically how their models are trained and validated on Colorado data. A model trained on national utility load data and applied to Colorado feeders without regional calibration will perform worse than a model trained on local historical interval data with Colorado-specific weather features. The difference matters most during the weather-driven peak events where accurate forecasting is most valuable.
Ampgrove has been building and running load forecasting models in Colorado since 2024. All our current pilot utility partners are in Colorado service territories. That means our model development, our feature engineering work, and our accuracy benchmarks are all grounded in the specific weather-load relationships that Colorado distribution operators face. We are not applying a generalized national model to a Colorado market. We built for this market specifically.
If you are a Colorado utility operations team evaluating whether your current forecasting approach adequately captures these regional patterns, we are happy to review your historical forecast error data against your feeder load records. It is a quick analysis that usually makes the accuracy gap concrete and specific to your system, rather than a theoretical argument about model architecture.